A Cost-effective Strategy for Multi-scale
Photo-realistic Building Modeling and Web-based 3-D GIS Applications in Real
Estate
Abstract
Web-based 3-D GIS may be the most appropriate tool for
decision makers in land management and development. It provides not only the
basic GIS functions, but also visually realistic landscape and architectural
detail. It also gives the user an immersive 3-D virtual reality environment
through the Internet that is rather different from that obtained merely through
text, pictures, or videos. However, in terms of high accuracy and
level-of-detail (LOD), the generation of a fully photo-realistic city model is
labour intensive and time consuming. At the same time, from the aspect of
computer graphics, the result is simply a geometric model without thematic
information. Thus, the objective of this study is to propose a cost-effective
multi-scale building modeling strategy based on the 2-D GIS building footprint
that has rich attributes and to realize its application in the real estate
market through a web-based 3-D GIS platform. Generally, the data volume needed
for a photo-realistic city model is huge, thus for the purpose of increasing
Internet data streaming efficiency and reducing the building modeling cost, a
multiple-scale building modeling strategy, including block modeling, generic texture modeling, photo-realistic economic
modeling, and photo-realistic
detailed modeling is proposed. Since 2-D building boundary polygons are
popularly used and well attributed, e.g., as to number of stories, address,
type, material, etc., we are able to construct the photo-realistic city model
based on this. Meanwhile, the conventional 2-D spatial analysis can be
maintained and extended to 3-D GIS in the proposed scheme. For real estate
applications, a location query system for selecting the optimum living
environment is established. Some geospatial query and analysis functionalities
are realized, such as address and road-junction positioning, terrain profile
analysis, etc. An experimental study area of 11 km2 in size is used
to demonstrate that the proposed multi-scale building modeling strategy and its
integration into a web-based 3-D GIS platform is both efficient and cost-effective.
Key words:
Web-based 3-D GIS, Multi-scale Building Modeling, Land Management.
l
Results of multi-scale building modeling
Examples of the photo-realistic
detailed model, photo-realistic economic model, generic texture model, block
model, and bird-eye view images are shown in Figures 4 to 8. In Figure 4,
one can see that the photo-realistic detailed model can
produce a comparably detailed model in geometry when compared with commercial
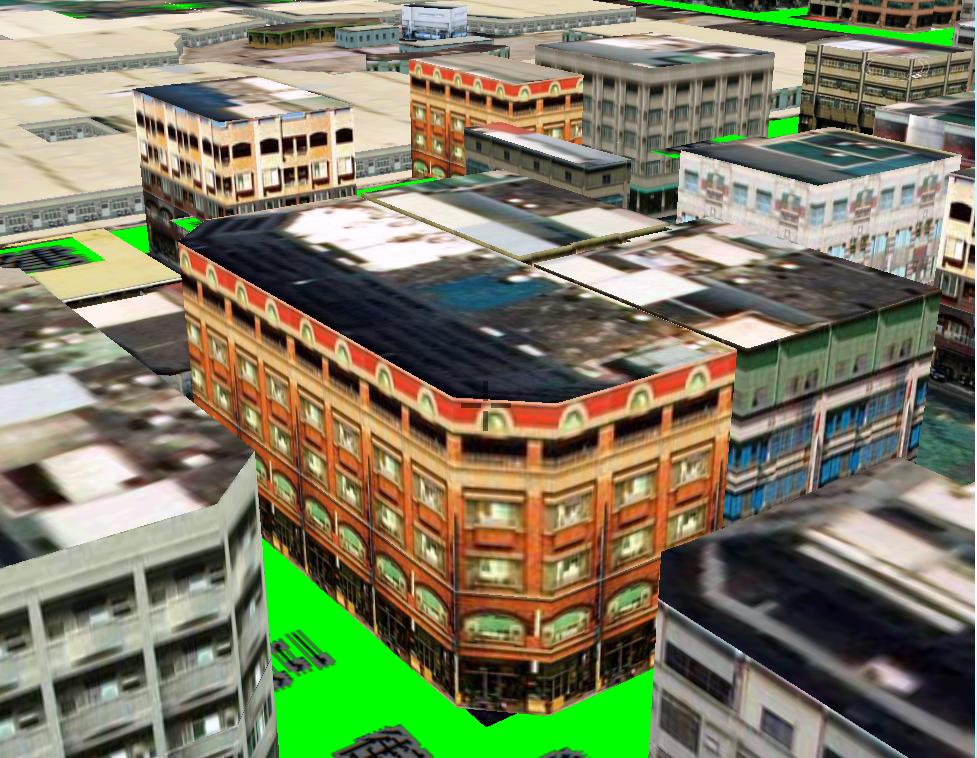
3-D modeling software. In Figure 5, the high-resolution texture of the photo-realistic economic model allows
for detailed identification of characters and signage, which demonstrate the potential
for further applications. The time consumption and man-power needed to perform
the photo-realistic detailed model is
about 3~4 times the economic one. The
amount of nodes and textures between them is also the same ratio. Figure 6
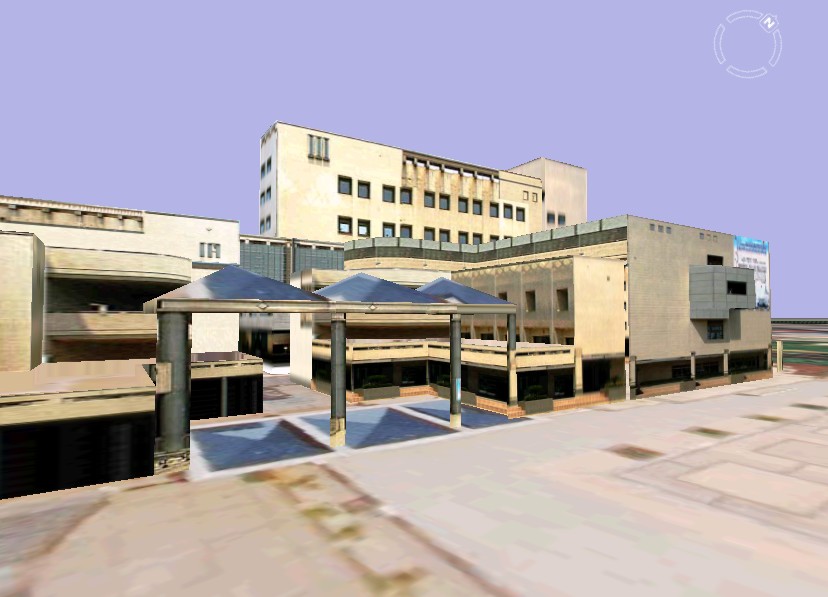
shows the buildings that are not along the main roads, described by the generic texture model. The purpose of
this model was not to produce high quality photo-realistic facade textures but
to provide images of sufficient realism to provide comfortable visual effect
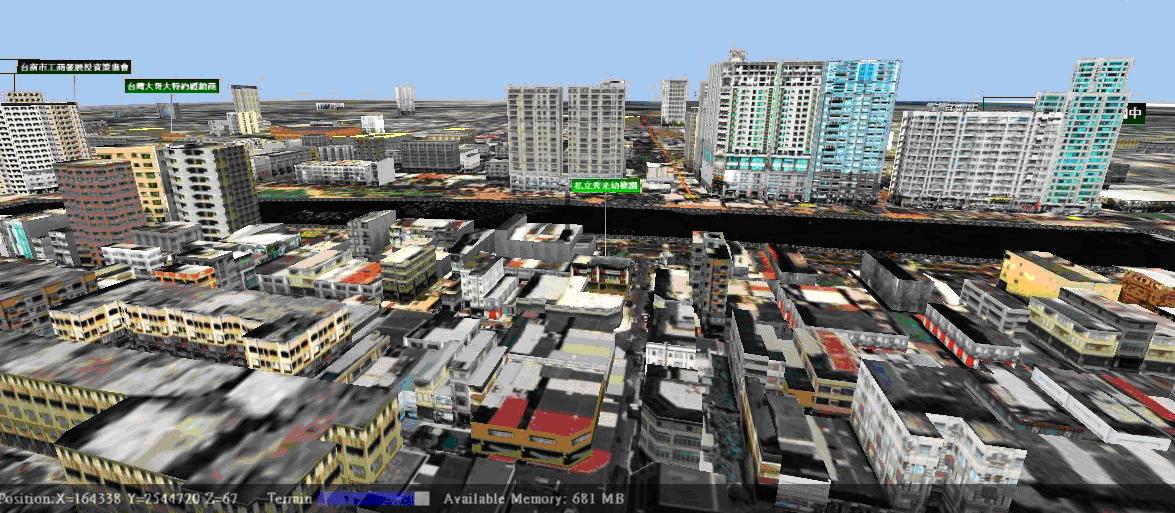
for the user. Figure 7 shows the created block
model, which was located outside of the study site. Figure 8 shows a
bird-eye view image demonstrating the produced multi-scale building models for
the whole study area. It demonstrates that
the model developed in this study is able to provide users with a
photo-realistic visual experience.
It took about 360 man-days to reconstruct the whole city
model. The total number of buildings in
Anping is 14,500, but only 3,500, i.e.,
about 1/4 of the total, were
reconstructed as photo-realistic economic and detailed models. The remainder, such as the generic texture models can be reconstructed fully
automatically. This means that with the proposed
multi-scale building modeling strategy, we can save 3/4 of effort to complete modeling of the whole city
with optimal visual effect and all possible GIS functionalities. Meanwhile,
from the point of view of efficiency, with the system the client can perform an interactive fly-through with 9-27 frames/sec.
Even in a wireless Internet environment, the 3-D scene rendering and spatial
query usually can be completed within 27 seconds. Figure 3 indicates the distribution of various scales of
building models used in the study.
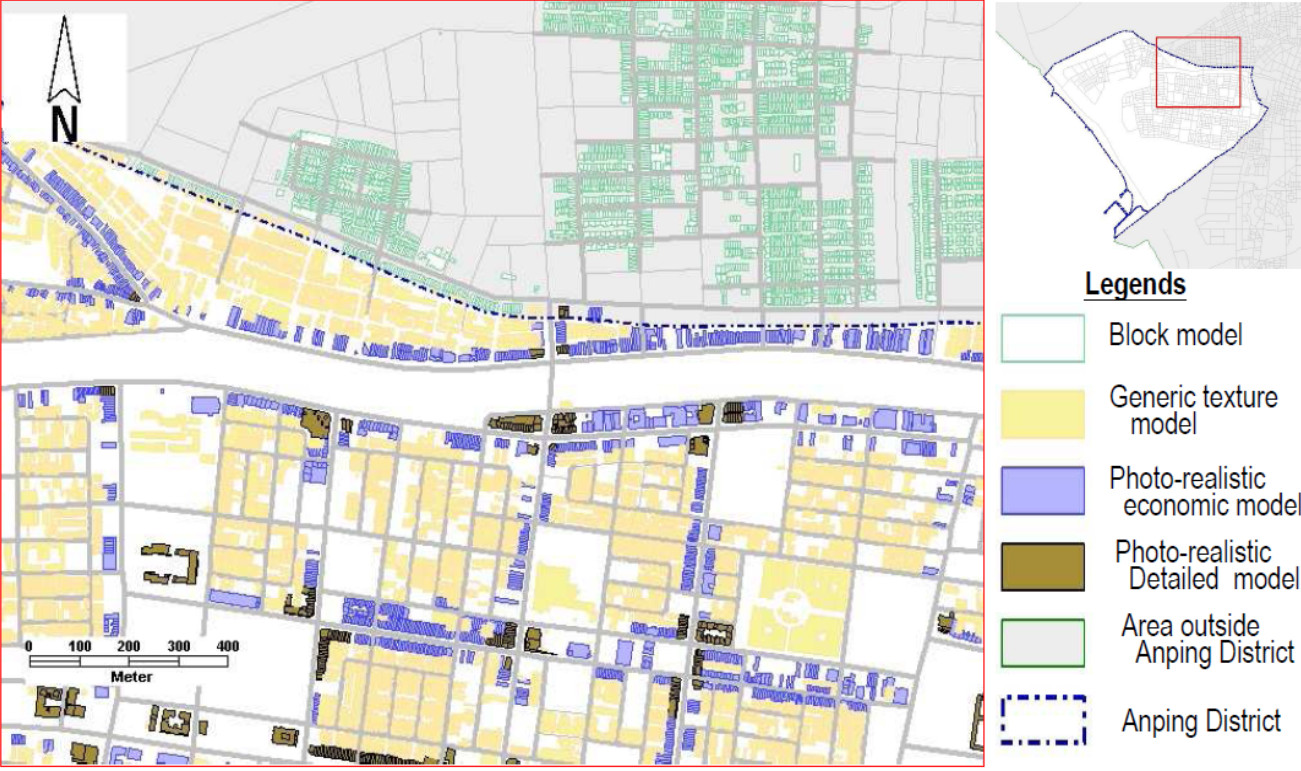
Figure
3. Distribution of various scales of building models
l
GIS query and spatial analysis
Two types of GIS techniques are implemented in this study,
namely the query and spatial analysis. In
general queries, we establish both text-based geographical positioning and
graphics-based geographical entity attribute queries. Thus, one can query a
specific location by means of the address, road
name, road junction, landmark, etc., with geographic coordinates stored in the
database. One may also
click anywhere during 3-D browsing. One can
then proceed with queries such as the Living function
facility, NIMBY, Special facility, and
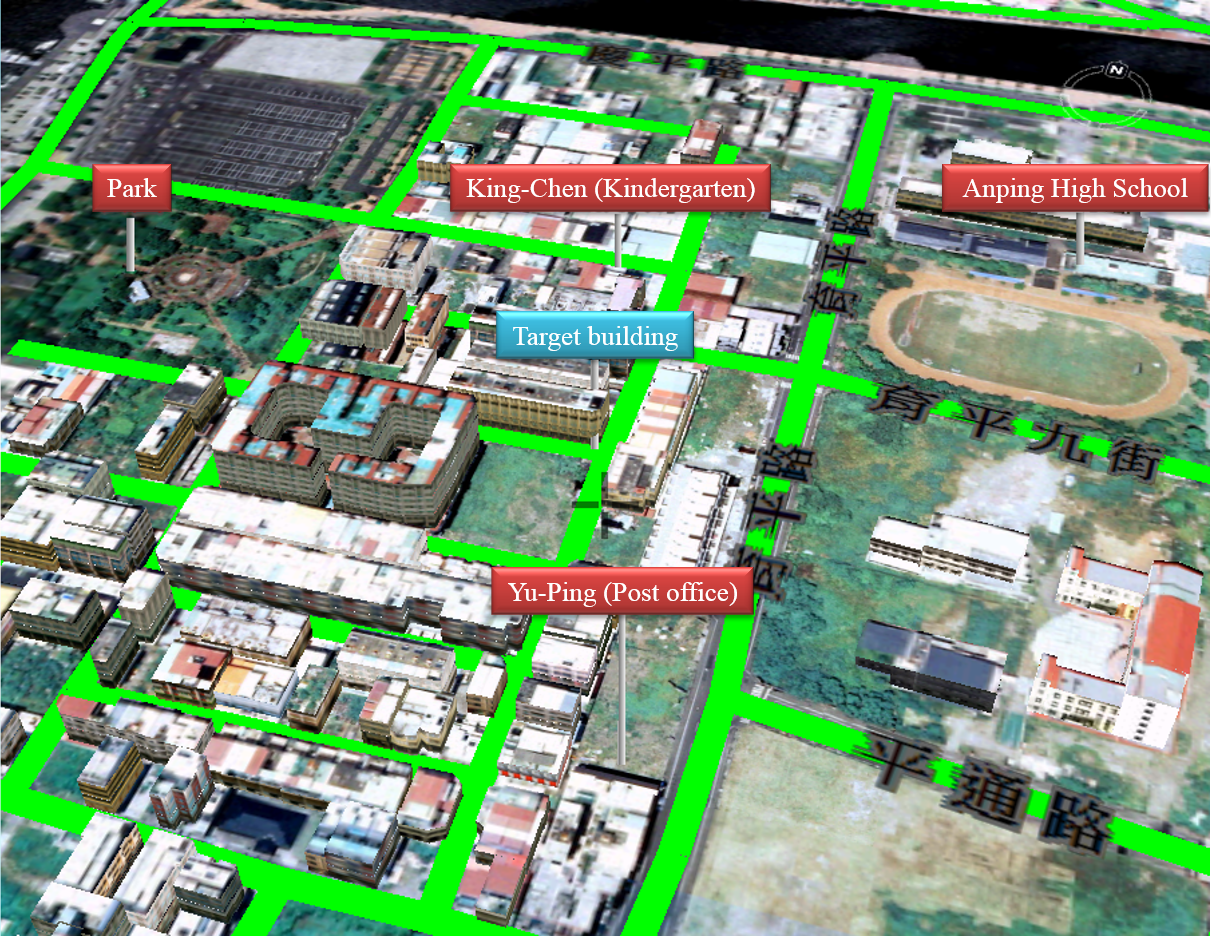
Other facility. An example of querying the
Living function facility is illustrated in Figure 9. In this example, four
Living function facilities are found within a radius of 250 meters from the
target building, including a park, a post office, a kindergarten, and a high
school. It seems that the target building would be a high quality living
environment for raising a child.
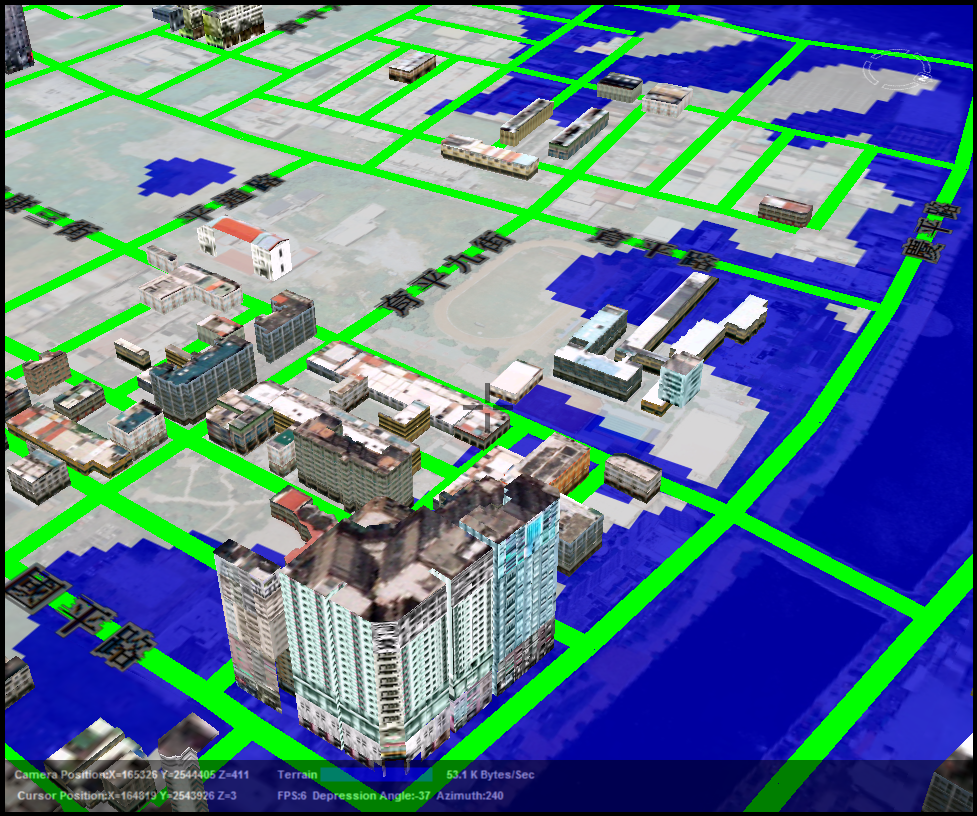
Four physical environment analysis functions of spatial
analysis (i.e., shadow simulation, view
shed simulation, terrain variation analysis, and sea level rise simulation) were designed to assist the user in the
evaluation of a suitable living environment. In the meantime, several
measurement tools and a route planning function were developed to assist the
user to estimate areas of interest. Figure 10 demonstrates a simulation of a
rise in sea level of three meters. In this scenario some buildings and roads
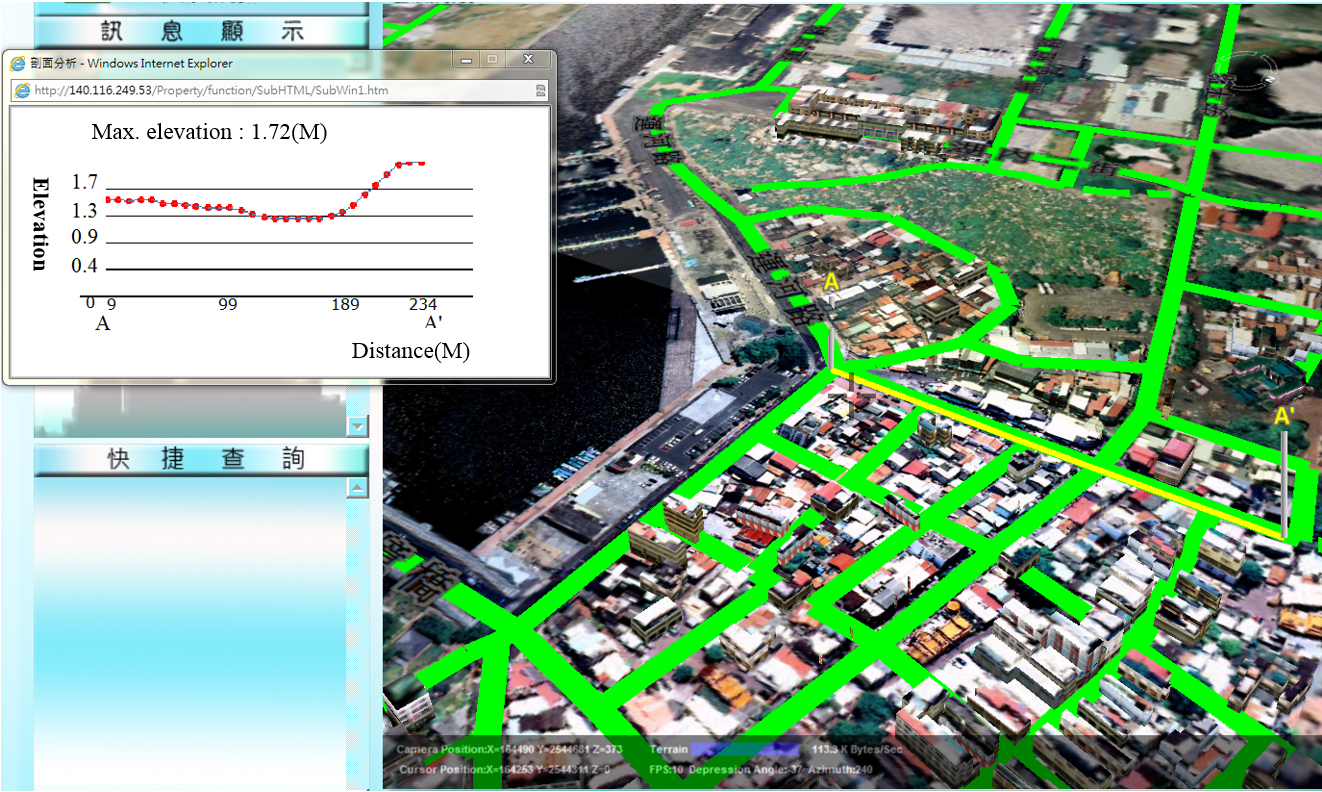
might be flooded (blue region). Meanwhile, one may also analyze variation in
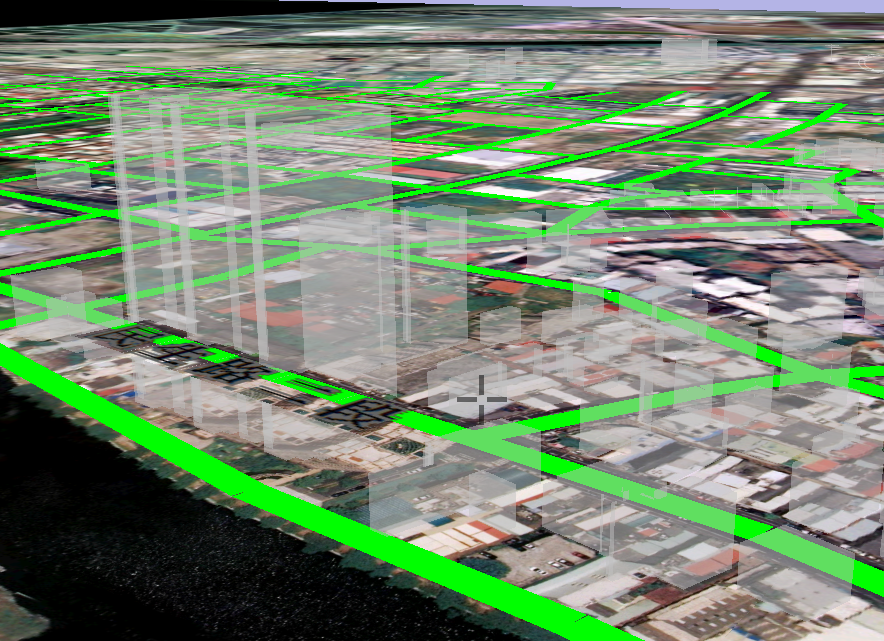
terrain elevation to evaluate possible flood-prone areas. Figure 11 shows that
the terrain elevation is 50-100 cm lower in the middle of the road compared to
points A and A’. This means that water may accumulate in this region after
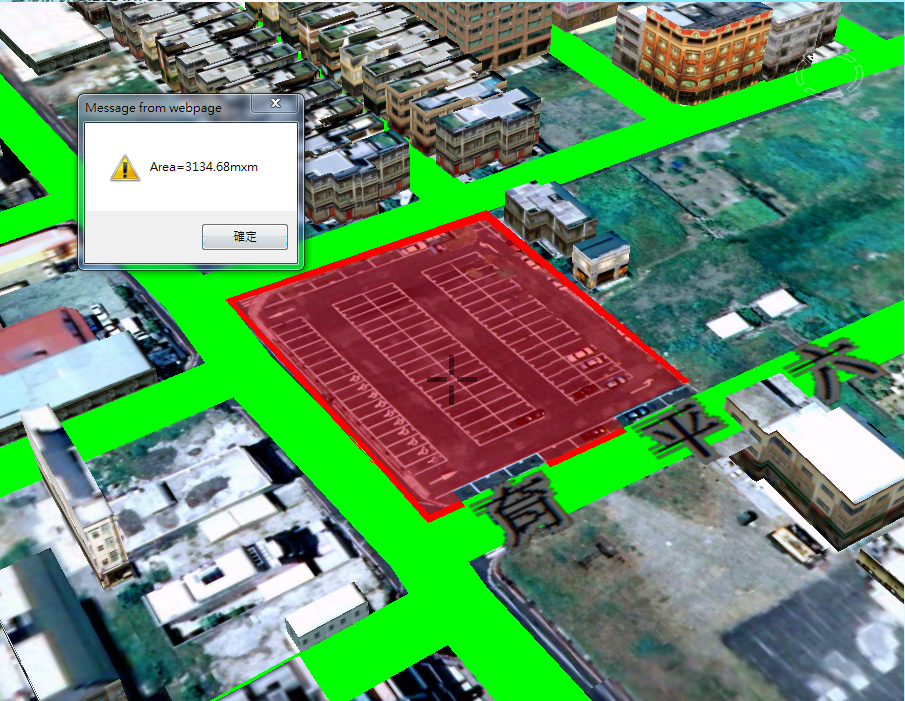
heavy rainfall. If the investigator plans to buy a parking lot for the
construction of a building, he/she can utilize the measurement tools to
estimate its area (as shown in Figure 12), width and distance to any Living function facilities, etc.
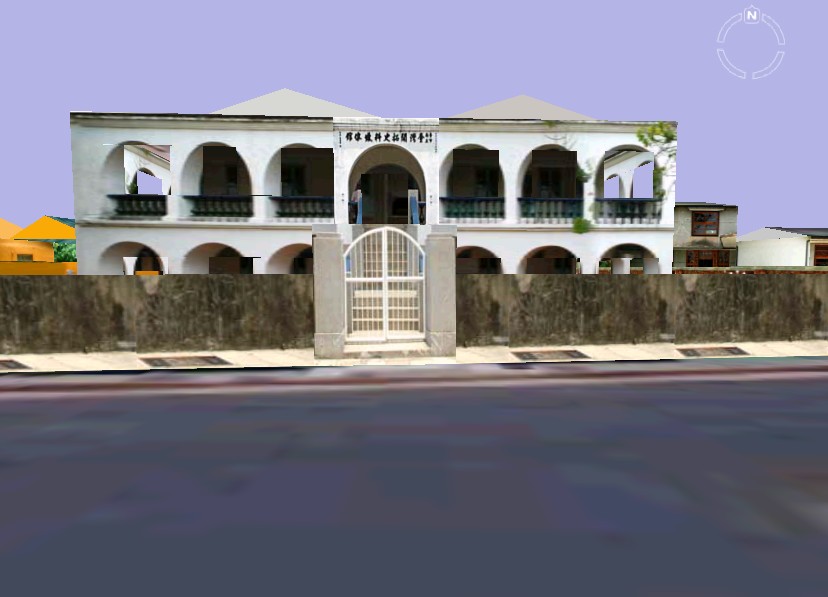
Figure
4. Example of a photo-realistic detailed model

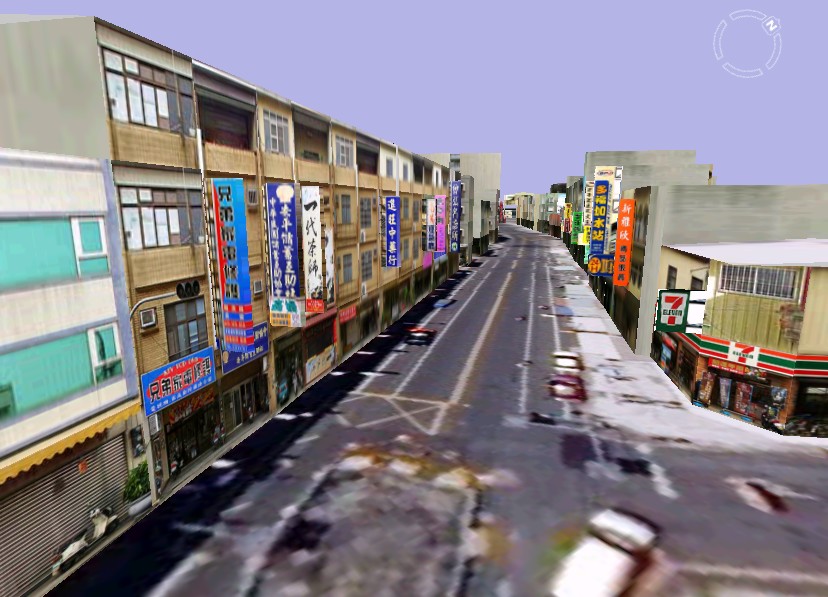
Figure
5. Example of a photo-realistic economic model
Figure
6. Example of a generic texture model
Figure
7. Example of a block model
Figure
8. A bird’s-eye view of the
major part of the study area
Figure
9. Example of a Living function facility query
Figure
10. Simulation of a rise in sea level of three meters
Figure
11. Analysis of terrain elevation variation
Figure
12. Measurement of an area of interest